Floating city growth chart
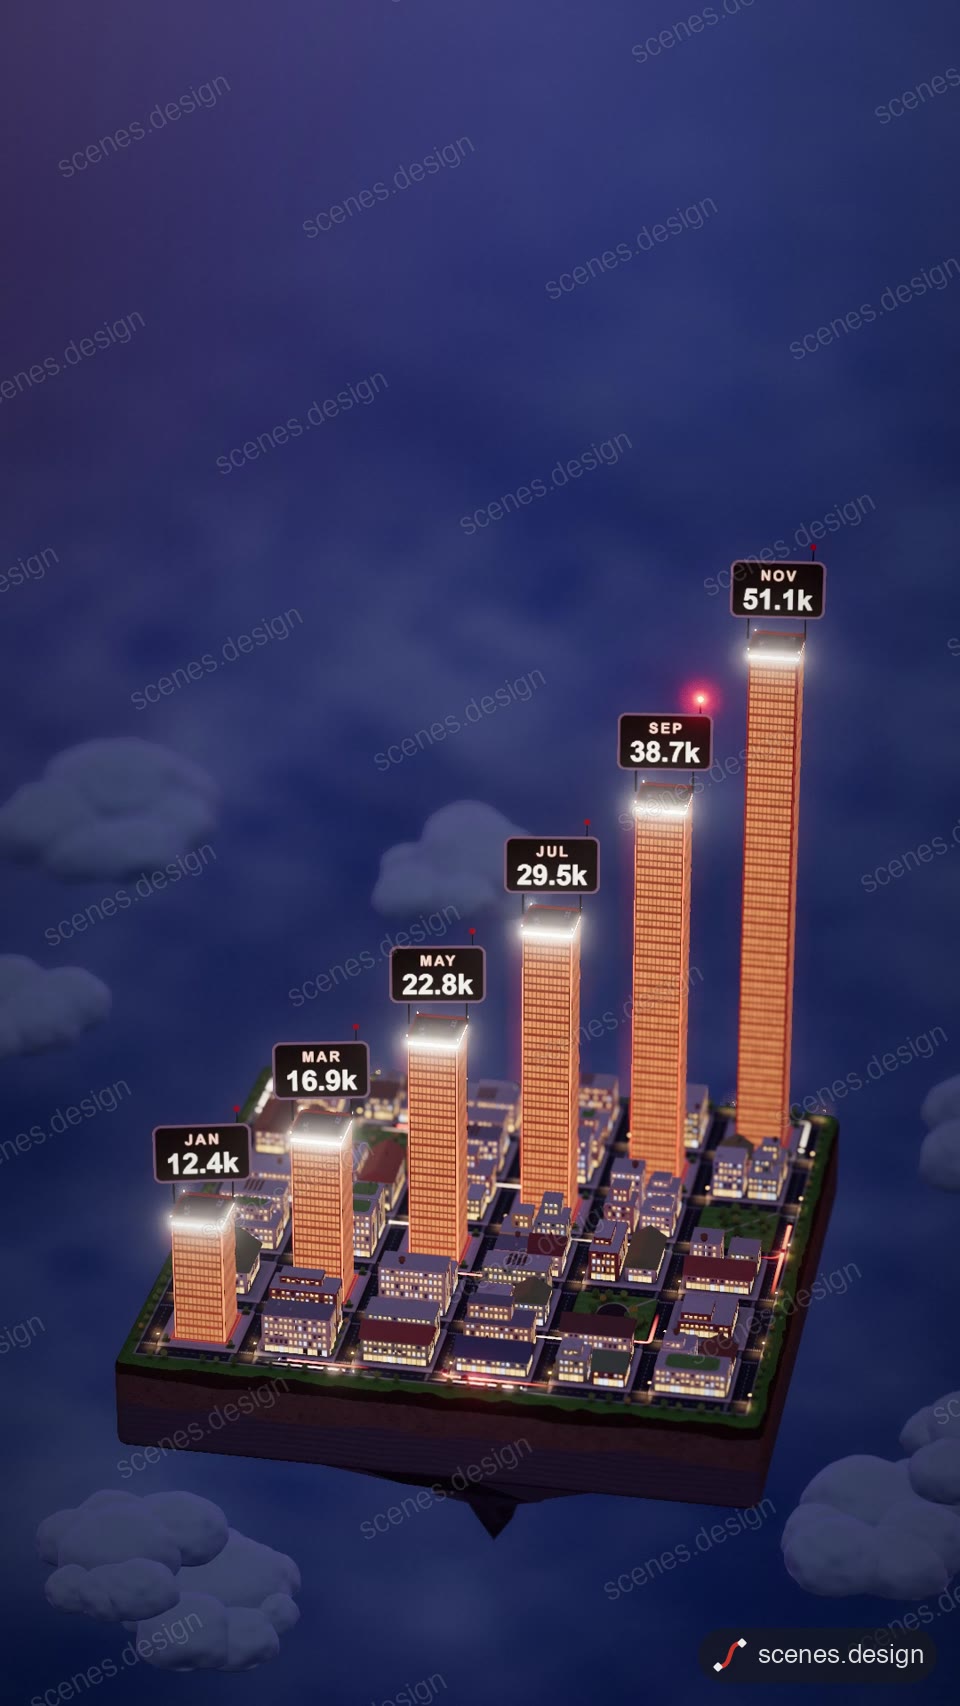
An animated growth chart where bars are skyscrapers on a floating toy city at dusk. Copy the prompt into Claude and chart your own figures and brand.
A tilt-shift toy city sits on a floating island above clouds. Up to six glass towers rise block by block from glowing pads, each wearing a rooftop sign with its label and a counting value. Golden hour fades to dusk, windows and car trails light up, a line draws through the tower tops and the headline stat lands.
Edit the headline stat, subline, brand name, what the bars measure, two to six labels and values, plus prefix and suffix such as $ or %. Recolour the towers, window lights and dusk sky. Good for investor updates, year-in-review posts and social stories about growth.
Use it for
- Investor update growth visual
- Year-in-review stats story
- Startup milestone announcement
Category: Charts. Format: vertical 9:16.
How to use this scene in Claude
Copy the scene's prompt into claude.ai or the Claude app and Claude builds it as a live preview. For an MP4, pull the scene into Claude Code and render it on your own machine with npx hyperframes render. Or add the Scenes connector (https://scenes.design/mcp) to Claude and just ask for the scene. Full steps: Docs.