Toy-brick city growth chart
A toy-brick city growth chart: six towers snap up brick by brick as a car drives past, then dusk falls. Copy the prompt into Claude and make it your own.
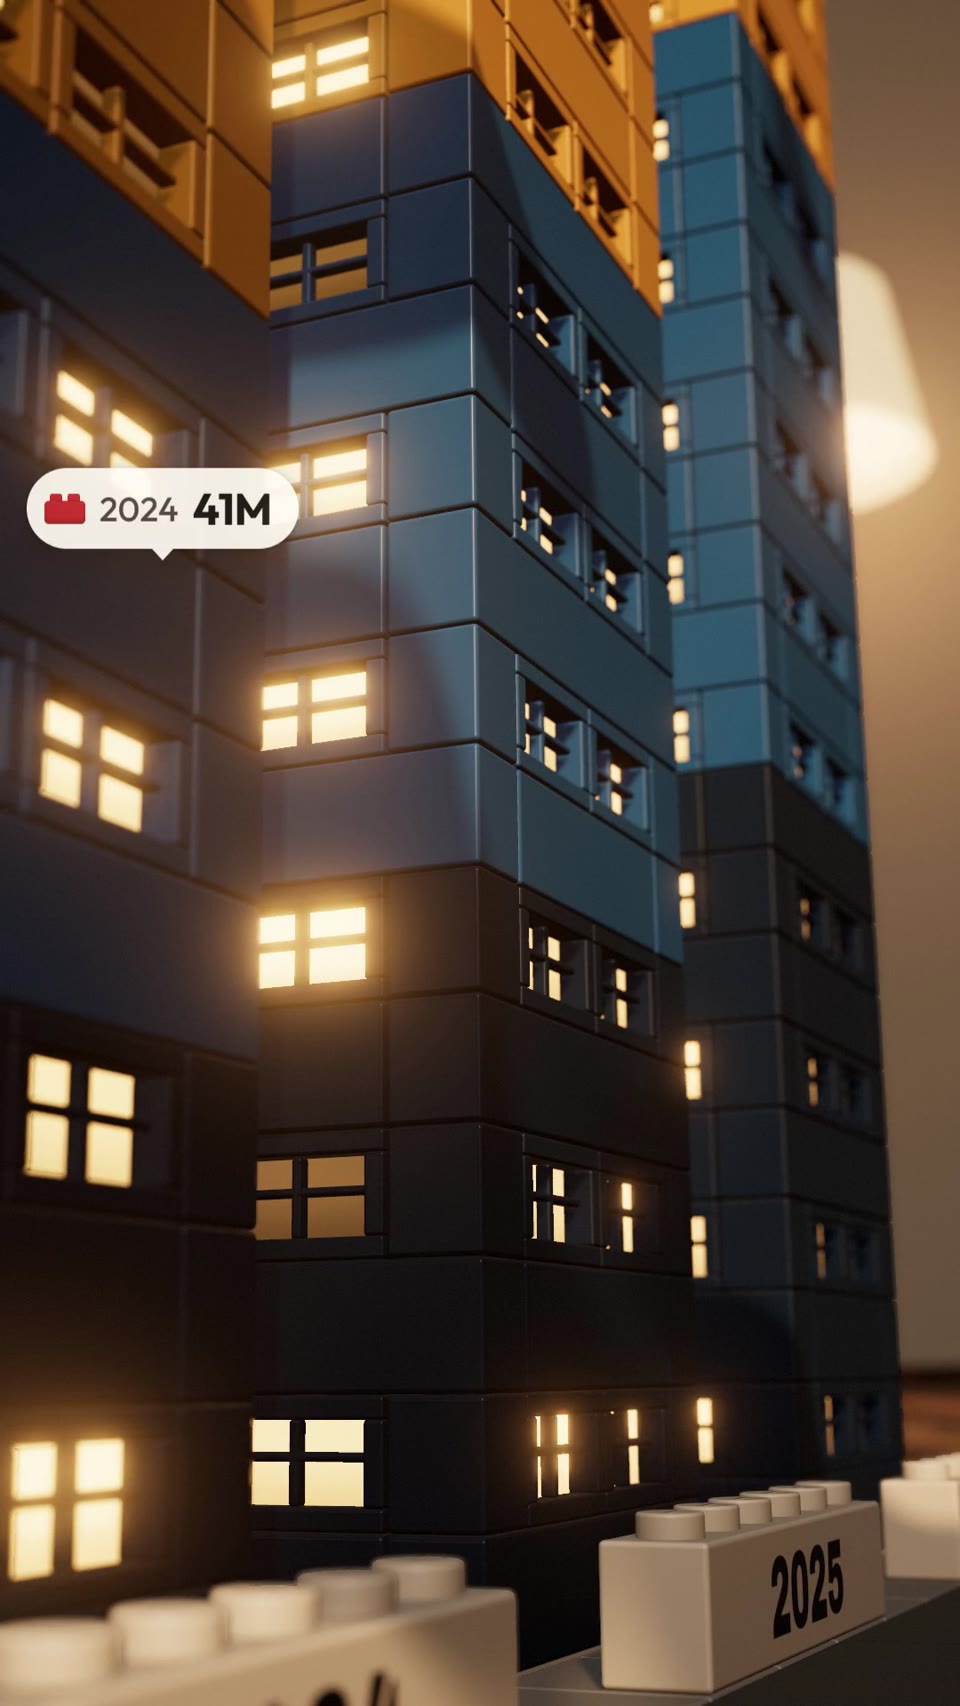
Six towers, one per year, build brick by brick on a living-room floor beside a road. A little brick car drives past, and each tower tops out as its nose draws level. The room then dims, the windows light up, the camera glides down the street, and a sunlit hero shot lands on the closing number.
Change the company name, first year, up to six values, value suffix, opening line, closing number and claim. You can also swap the brick brand and the four quarter colours. It is a 14-second vertical piece, suited to Reels, TikTok, Shorts and LinkedIn results posts.
Use it for
- Annual results social post
- Investor update teaser
- Year-by-year growth story
Specs
- Length: 14 seconds
- Format: vertical 9:16 (1080x1920), 30 fps
- Built with: Three.js in HyperFrames
- Category: Charts
What happens, beat by beat
- 0 to 2.3 s, hook. Wide high view (elevation 40, distance 1400 easing to 1280) of six grey footprints. The first tower is already topping out by 0.6 s. Big white two-line title from frame 0…
- 2.3 to 7.05 s, the build. The car drives the near lane; a monotone cubic spline places its nose level with each tower at 2.9, 3.9, 4.9, 5.95 and 7.05 s. The camera dollies tower to…
- Value tags. A cream pill with a tiny Q4 brick icon, the year and the value ([unit suffix, e.g. M]) pins to each tower top as it tops out, popping in with a back ease. Earlier…
- 7.1 to 8.5 s, skyline. Wide on all six towers and tags. The room drops about a stop, lamps and bloom rise, and windows switch on left to right, earliest year first (from 7.75 s, 0.11…
- 8.5 to 10 s, street glide. Hard cut to a low camera gliding along the street at dusk, shallow focus on the nearest facade; each year's tag pops at its facade as the camera passes, then…
- 10 to 14 s, hero. Hard cut to a sunlit three-quarter view from front-left, slowly pushing in. All six tags pop back onto the tops (staggered 0.08 s). From 10.45 s, top-left in dark text with…
Light it like late afternoon through a window
- One warm sun (#ffc68c) from front-left at about 30 degrees elevation, with a 4096 shadow map fitted tightly round the city for crisp stud shadows.
- The window is an analytic cookie patched into lights_fragment_begin for light 0: trace each shaded point back along the sun to the window wall and mask by the opening, mullions…
- Fill: a hemisphere light plus a PMREM room environment with a bright window strip for stud highlights. Warm point lights in the lamp shades pool on the back wall.
- Plastic: MeshPhysicalMaterial, roughness 0.3, clearcoat 0.5, clearcoat roughness 0.16. Window panes switch on per instance with a custom attribute (switch-on time, brightness, about 14% stay dark) and a warm emissive…
What you can change
- Expose as variables: company, first year, comma-separated values (up to six), unit, hook, headline and claim (with {company} {first} {year} {last} {growth} tokens, growth =…
How the prompt opens
Make a silent 14-second, 9:16 (1080x1920), 30 fps motion piece in Three.js. A bar chart is built as a photoreal toy-brick city on a living-room floor: six towers, one per year, snap up brick by brick beside a road while a little brick car drives past, each tower topping out as the car's nose draws level. Then the room dims and the windows light up, the camera glides down the street at dusk, and it cuts to a sunlit hero shot with the closing number. The data is [your values, e.g. revenue by year: 12, 19, 27, 41, 58, 86] for [your company, e.g. an invented firm called ORBIT], starting at [first year, e.g. 2021].
The full prompt runs 1,107 words. Copy it free (2 a day) from this page.
Copy the prompt into Claude, or pull the scene into Claude Code and render the MP4 on your machine: how it works.