Toy soldier data story
A toy soldier data story: helmets drop into a grid, recolour by group, ride up a 3D bar chart, then land on a map. Copy the prompt into Claude to edit it.
Toy helmets drop one at a time into a grid under a compass rose on a charcoal floor. The grid recolours by group while a counter rolls up to the total. The camera dives onto one helmet, which rides a bar as the chart rises, then a green figure stands on a folded map as the camera cranes up.
Edit the icon shape (helmet, pawn or house), the groups and colours, what one icon stands for, the counter and its caption, the bar chart title and bars, the big map number, the corner tag, and the studio and plastic colours. It fits explainers, reports and news-style data pieces at 1920x1080.
Use it for
- Explaining a statistic to viewers
- Annual report data highlight
- Documentary-style data explainer
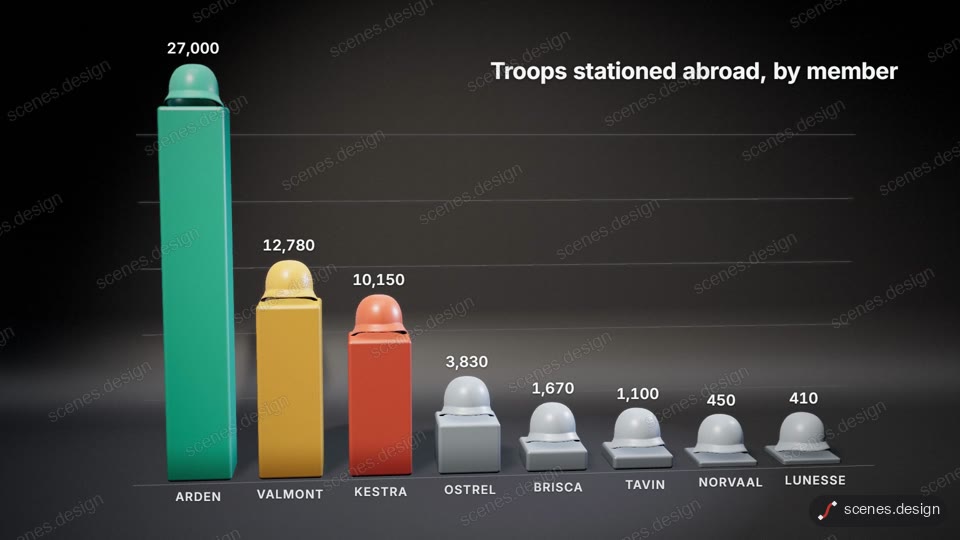
Category: Charts. Format: widescreen 16:9.
How to use this scene in Claude
Copy the scene's prompt into claude.ai or the Claude app and Claude builds it as a live preview. For an MP4, pull the scene into Claude Code and render it on your own machine with npx hyperframes render. Or add the Scenes connector (https://scenes.design/mcp) to Claude and just ask for the scene. Full steps: Docs.