Outage file on a 3D night map
A 30-second vertical outage explainer on a 3D night map: red wave, dive into one region, then a white re-light. Copy the prompt into Claude, render free.
A night line-map of the world loses every service dot in a red wave. The camera dives into the one region it began in, finds the racks and the single character that caused it, then follows the failure through a dependency graph and a UTC timeline before a white wave re-lights everything.
Change the company name, region code and location, incident date, outage length, sign-in servers lost, failed requests, opening and closing captions, evidence highlight, and the failure and healthy colours. It is 30 seconds of 9:16, made for post-mortem recaps on Shorts, Reels and LinkedIn.
Use it for
- Cloud outage post-mortem recap
- Incident timeline for engineering updates
- Status page story for social
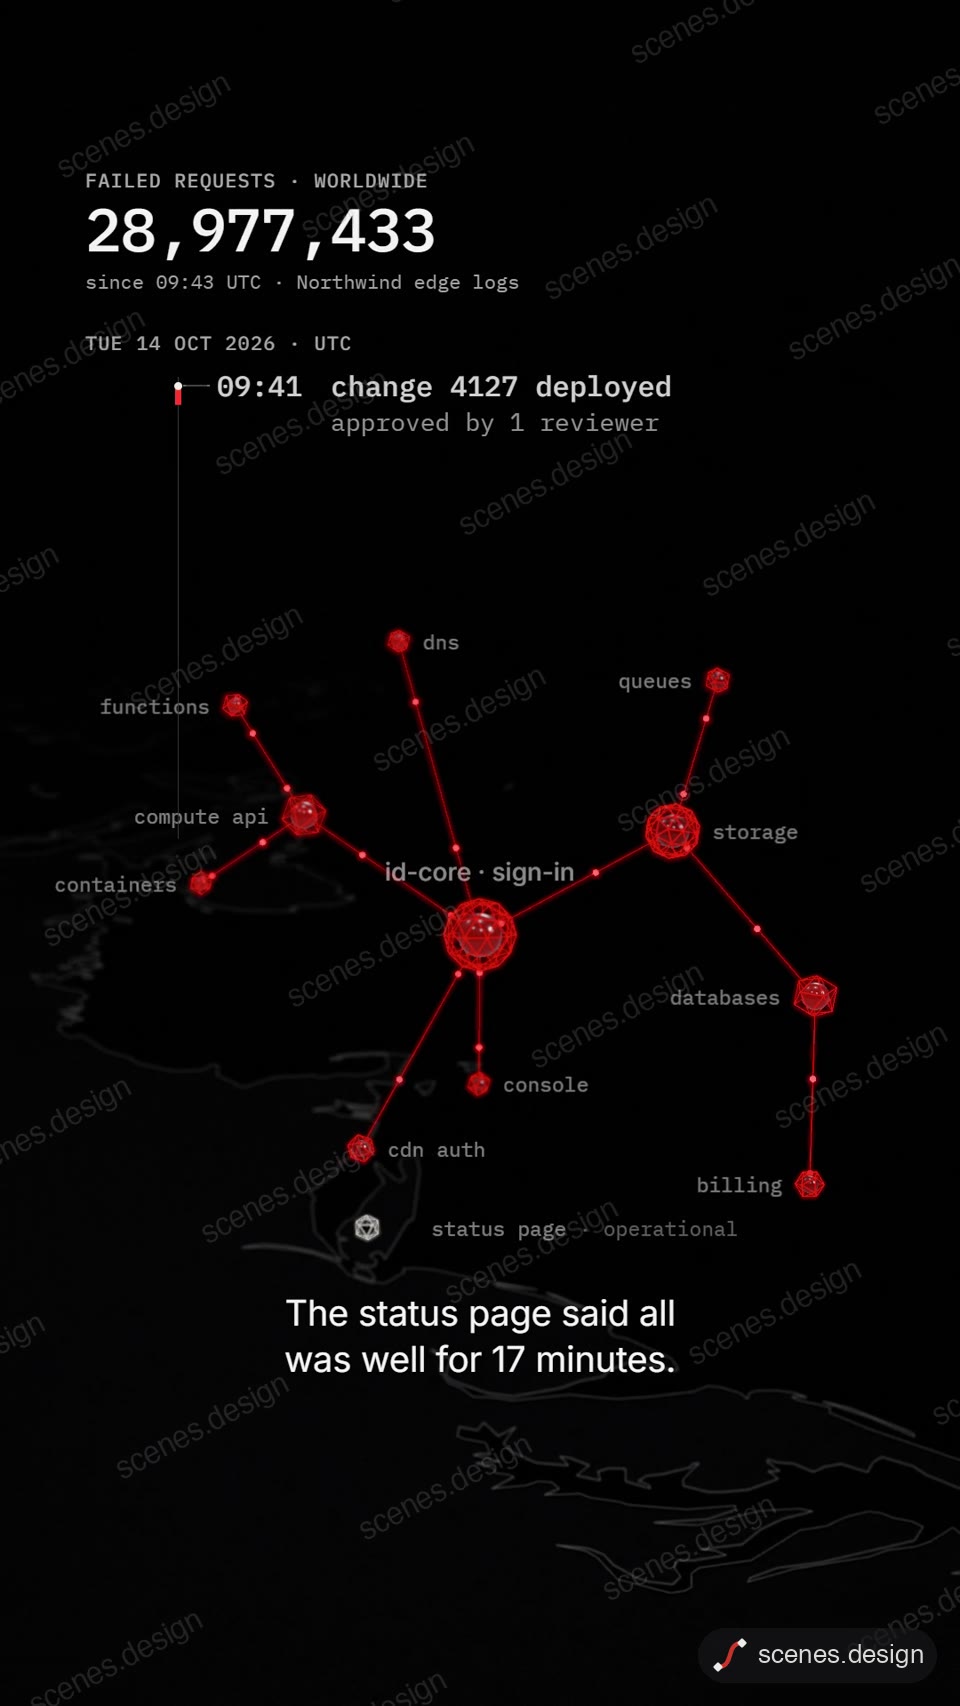
Category: Maps. Format: vertical 9:16.
Free evidence file pack: Black-screen intelligence files: timestamps, documents with highlighted lines, line maps and captions that carry the story.
How to use this scene in Claude
Copy the scene's prompt into claude.ai or the Claude app and Claude builds it as a live preview. For an MP4, pull the scene into Claude Code and render it on your own machine with npx hyperframes render. Or add the Scenes connector (https://scenes.design/mcp) to Claude and just ask for the scene. Full steps: Docs.